Plan Field Work#
This procedure makes a plan for the fields with the Run Optimizer, reads the result and drives the plan of one field in the simulation. It also runs the optimizer from the command line and reads the result files.
Before You Start#
- Build the packaged game. Refer to Build the Game.
- Do the commands in the repository root.
- Read the scenarios of the Optimizer model if you want the equations.
CAUTION
Run only one instance of the game at a time. Two instances can use all the memory of the GPU.
The optimizer has three scenarios.
| Scenario | Result for Each Field | Colour of the Map |
|---|---|---|
| Field Operation Plan | Pass direction, passes, hours, fuel and the position in the route. | The position in the route. |
| Traction and Fuel Setup | Ballast, gear, speed, slip, fuel and cost. | The cost for each hectare. |
| Harvest Timing against Rain | Start and end of the harvest, grain moisture and loss. | The start hour. |
Make a Plan in the Menu#
-
Start the game without options.
Expected Result
The game shows the menu.
-
Select Run Optimizer.
Expected Result
The configuration page opens. It has the tabs Optimize, Fields, Weather, Tractor and Additional.
-
On the tab Optimize, select the scenario Traction and Fuel Setup.
-
Select the field operation, for example Chisel Plow (Maxxum 2.7 m).
-
Set the limits of the search: Ballast Available, Minimum Wheel Slip, Maximum Wheel Slip and Maximum Field Speed.
-
Set the costs: Diesel Price and Operator + Machine Cost.
-
If necessary, change the crop, the soil or the wetness of a field on the tab Fields.
-
Select Run.
Note
The scenario Harvest Timing against Rain uses the weather of the tab Weather. Set a rain event there before you select Run.
Read the Result#
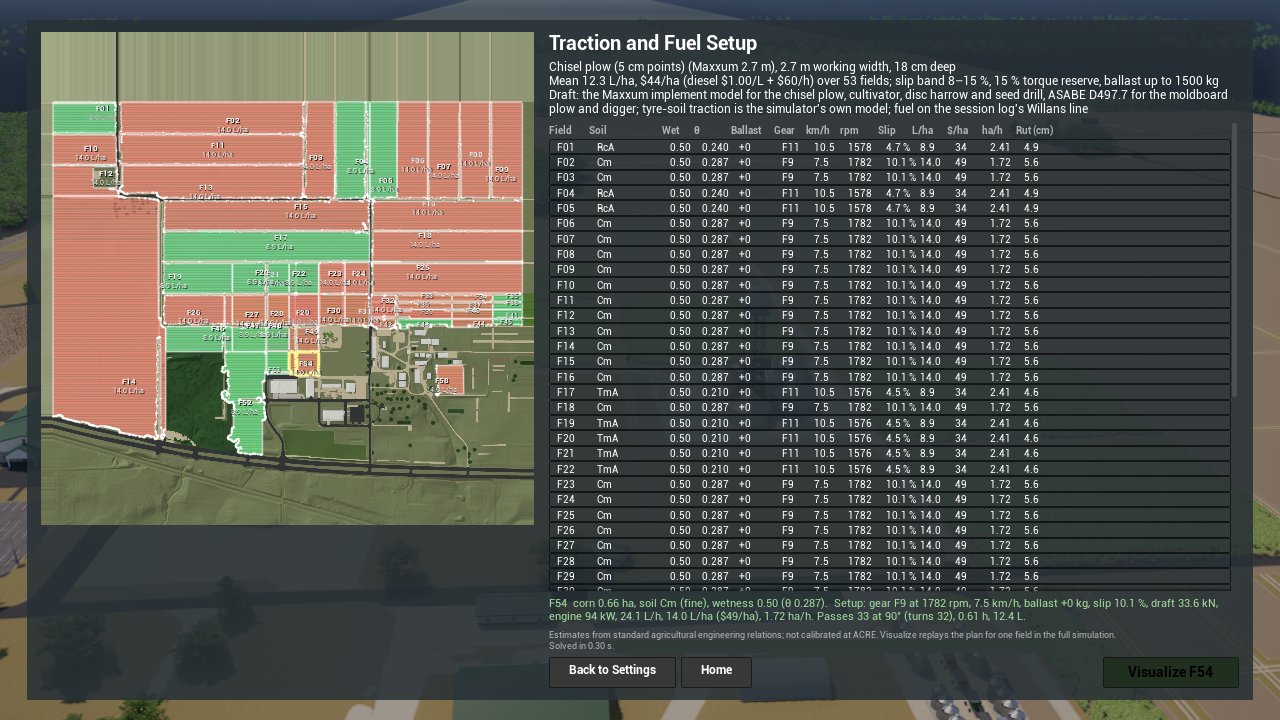
-
Read the summary at the top right. It gives the operation and the totals or the means of all fields.
-
Read the map. Green is the good end of the colour scale and red is the poor end.
Item on the Map Meaning Colour of a field The value of the scenario for that field. Grey field The field has no result. The table gives the cause in the column Note. Label of a field The field identifier and the key value, for example 8.9 L/ha.Yellow outline The selected field. Orange line The road route of the scenario Field Operation Plan. The square is the start. -
Select a field on the map or a row in the table.
Expected Result
The text below the table shows the setup of the field. For F54 it is this text.
-
Read the column Slip of the table. A value outside the slip band shows that the search found no setup in the band for that field.
Expected Result
With the default settings, the 18 fields on the soils
RcA,RoBandTmAhave a slip of 4.5 % to 4.7 %. This is below the band of 8 % to 15 %. The 35 fields on the soilCmhave a slip of 10.1 %. -
Read the column Note of the scenarios Field Operation Plan and Harvest Timing against Rain. It gives the cause when a field has no result.
Visualize the Plan of One Field#
-
Select a field with a setup on the result page.
-
Select Visualize F... The button shows the identifier of the selected field.
Expected Result
A path replay session starts at the first pass of the field. The Maxxum has the ballast and the implement of the plan. The log contains these lines for F45.
-
Monitor the speed on the HUD during the first pass.
-
Stop the session with Esc and End Simulation.
-
Compare the session log with the plan. Session Log gives the columns of
tractor.csv.
CAUTION
Do not use the numbers of a plan before you compare them with a path replay.
In the test above, the Maxxum did not keep the planned speed with the chisel plow.
The current replay stops after 10 s below 0.15 m/s with a target above 0.5 m/s.
It reports stalled, applies the brake and requests an implement lift. The plan has failed this replay test. Optimizer gives the measured values.
Note
For the scenario Harvest Timing against Rain, the session starts at the planned hour of the field. The rain event moves with the clock.
Run the Optimizer from the Command Line#
The menu has test options that set the parameters and select Run without a mouse. Menu Settings lists the identifiers of the parameters.
-
Run the scenario Traction and Fuel Setup without a window.
Packaged/Linux/Acres.sh -RenderOffscreen -MenuOpen=optimizer \
  "-MenuSet=opt:scenario=traction;opt:operation=chisel" \
  -MenuRunNow -MenuShot=/tmp/optimizer.png -MenuExitAfterShot
Expected Result
The game stops after approximately 10 seconds. The log contains one line with the summary and the output folder. This page shows the line on several lines.
LogTemp: Display: ACRES_OPTIMIZER Traction and Fuel Setup
  | Chisel plow (5 cm points) (Maxxum 2.7 m), 2.7 m working width, 18 cm deep
  | Mean 12.3 L/ha, $44/ha (diesel $1.00/L + $60/h) over 53 fields;
    slip band 8–15 %, 15 % torque reserve, ballast up to 1500 kg
  | ...
  | /home/user/ACRES/Packaged/Linux/Acres/Saved/Optimizer/20261002-030448-traction
The file
/tmp/optimizer.pngshows the result page. -
Run the scenario Field Operation Plan for the empty fields.
Packaged/Linux/Acres.sh -RenderOffscreen -MenuOpen=optimizer \
  "-MenuSet=opt:scenario=plan;opt:operation=chisel;opt:fields=empty" \
  -MenuRunNow -MenuShot=/tmp/optimizer.png -MenuExitAfterShot
Expected Result
LogTemp: Display: ACRES_OPTIMIZER Field Operation Plan | Chisel plow (5 cm points) (Maxxum 2.7 m), 2.7 m working width | 4 fields, 2.5 ha in 2.0 h (1.9 h in field, 1.3 km road), fuel 40 L (15.9 L/ha) | Pass headings minimize passes + 4.7 m-radius U-turns; headland 3 laps; start and route from the Beck lot | ... -
Run the scenario Harvest Timing against Rain with the rain event of the Weather tab.
Packaged/Linux/Acres.sh -RenderOffscreen -MenuOpen=optimizer \
  "-MenuSet=opt:scenario=harvest;env:rain.enabled=1" \
  -MenuRunNow -MenuShot=/tmp/optimizer.png -MenuExitAfterShot
Expected Result
LogTemp: Display: ACRES_OPTIMIZER Harvest Timing against Rain | Rain-aware: 48 of 49 fields in 7 days, 0 h on soil wetter than field capacity, grain loss 0.8 %, drying shrink 4.5 % | Start-now baseline (stop only while raining): 48 fields, 0 h rutting wet soil, grain loss 0.8 %, drying shrink 4.5 %. Rain: 10 mm over 1 h | ... -
Add
-MenuOptVisualize=<field>to start the path replay of one field after the screenshot. Do not use-MenuExitAfterShotwith it.
| Option | Function |
|---|---|
-MenuOpen=optimizer |
Opens the configuration page of the optimizer. |
-MenuSet=id=value;id=value |
Sets parameters. Put the option in quotation marks, because the shell reads the semicolon. |
-MenuRunNow |
Selects Run at the start. |
-MenuShot=<file> |
Writes a screenshot after 6 seconds. The other test options need it. |
-MenuExitAfterShot |
Stops the game 3 seconds after the screenshot. |
-MenuOptVisualize=<field> |
Selects Visualize for the field number 3 seconds after the screenshot. |
Read the Output Files#
Each run writes a folder Packaged/Linux/Acres/Saved/Optimizer/<stamp>-<scenario>.
| File | Contents |
|---|---|
fields.csv |
One row for each field: soil, setup, coverage, route and harvest values. |
fields.geojson |
The outlines of the fields with the value and the label of the map. |
result.json |
The scenario, the title and the summary lines. |
visualize-F<id>.csv |
The replay path of one field. Visualize writes it. |
-
Find the folder of the last run.
-
Read the table of the fields.
import csv
import json
from pathlib import Path

runs = Path("Packaged/Linux/Acres/Saved/Optimizer")
run = sorted(runs.iterdir())[-1]
rows = list(csv.DictReader(open(run / "fields.csv")))
print(run.name, len(rows))
for row in rows[:3]:
    in_band = 0.08 <= float(row["slip"]) <= 0.15
    print(row["field"], row["soil"], row["gear"], row["speed_kmh"],
          row["slip"], row["fuel_l_ha"], row["cost_per_ha"], in_band)
Expected Result
The last column shows if the slip is in the slip band of 8 % to 15 %. The file has no column for this condition.
-
Read the summary.
raw = (run / "result.json").read_bytes() encoding = "utf-16" if raw[:2] in (b"\xff\xfe", b"\xfe\xff") else "utf-8" text = raw.decode(encoding).replace("\\'", "'") result = json.loads(text) print(result["schema"], result["scenario"], result["value"])The example corrects two properties of the file that a JSON parser does not accept.
- The game writes the file as UTF-16 when a summary line has a character outside ASCII.
- The game writes an apostrophe in a summary line as
\'.
-
Open
fields.geojsonin a GIS program to see the fields on a map.
Note
The coordinates of fields.geojson are NAD83(HARN) latitude and longitude. They differ from WGS84 by approximately 1.3 m.
Next Steps#
- Optimizer gives the equations, the parameters and the limits of each scenario.
- Replay describes the path replay that Visualize starts.
- Set Soil and Weather shows how to change the soil and the rain that the plans use.
- Menu Settings lists the parameters
opt:*.